

Trading Day Recap - Friday, 1/5/24
Trading Day Recap - Friday, 1/5/24

I usually need to run errands on Fridays. Often, I put on a trade and leave my desk, take care of business, come back and see how the trade has done. The last few times I have done this the trade has gone in my favor considerably and then retraced stopping me out for a R1 loss for the day. This happened today, again.
This new year I am going to put a stop to this. I need to be fully present and trading 5 days a week, 7 hours a day. All errands can be taken care of once the market closes or if I stop trading for the day.
The jobs report came in much hotter than anticipated. Even though December is a seasonal month for hiring the US created 216K jobs for the past month. The market initially reacted with a leg down but that did not last as they started buying the market almost immediately. Not sure the reason for this, it could’ve been the unemployment rate which ticked down by 0.1%.
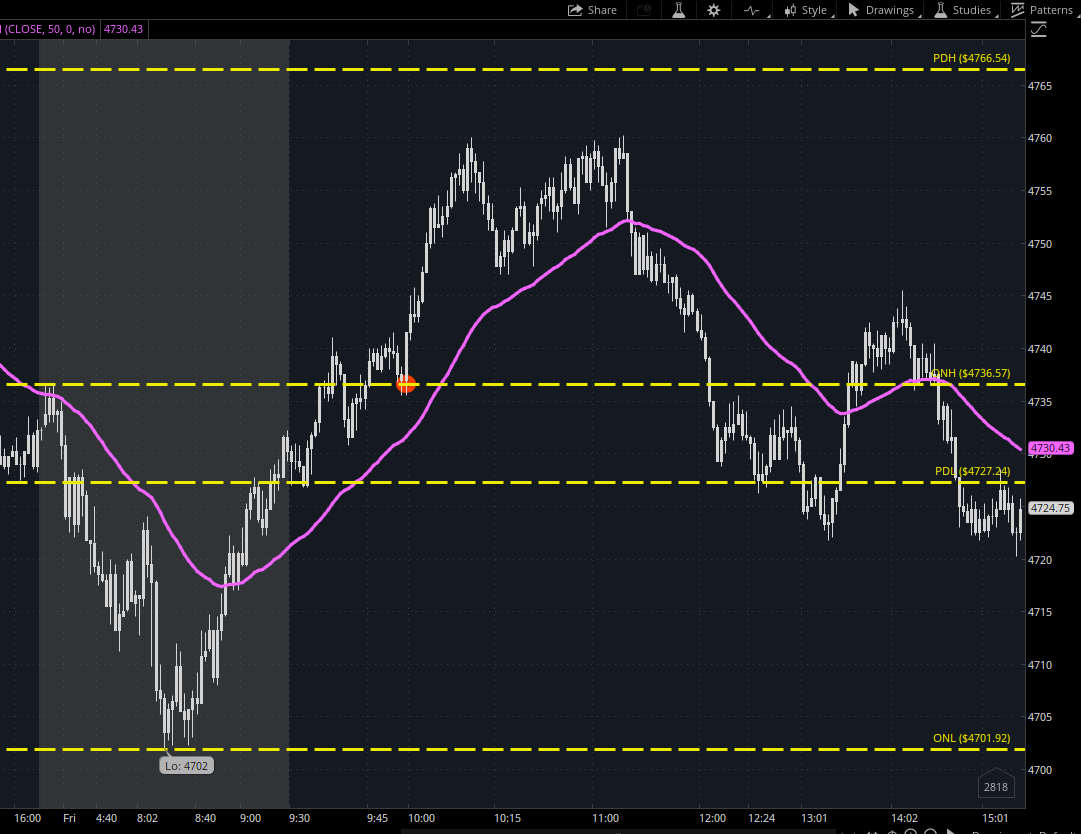
I waited until 10 a.m. for the ISM PMI and when the market popped off the ONH I entered the market and left the house soon after to take care of business. On returning right before the close I was disappointed to see the price action for today. Again, sometimes this can work if there is a one directional move and you remove the profit target from the bracket order and let it run. But the market can also turn around give back all of the profits and stick you with a R1 loss for the day. This is what happened today.
Enough about this for today though.
I want to show you a chart for Oil Futures /CL – below. Oil can make dramatic moves especially with the crisis in the middle east and a willingness by OPEC to manipulate oil prices, CL is a very good contract to daytrade as well. Primarily I used to be an oil trader back in the day but once I discovered NQ futures, I have been concentrating primarily on the NQ but I do keep an eye on oil especially when there is geo-political tension.

If you look at the chart for the last 4 sessions including overnight action, you will see that my cusp trade has appeared perfectly on the chart multiple times. For oil I use a 1597 tick chart and a 50EMA. Again going with the fibonnaci sequence, 1597 is a fib number and if you don’t know what it is, you can read about it here. I use lower tick number for oil because the volume for oil is a lot less than the NQ or ES. Something for you the reader to investigate if that interests you.