
How I Trade - The Cusp Strategy.
purely for informational purposes. this is not trading advice.

I’ve been getting a lot of questions on Twitter lately about my trading results. Traders want to know how I’m able to consistently have big profitable days. They wonder, what it is I am doing different that they are not doing.
The short answer is I have 15 years experience, and you the struggling trader do not.
This might sound glib, but when I look back on my struggles the first few years it was my lack of experience and understanding of the nature of the market, and the process of trading that kept me static and frustrated and ready to give up multiple times because I was certain I would never succeed in this business which seemed so tricky and impossible to get a grip on.
But with time, trial and error, and a lot of work I morphed into a disciplined professional trader with a fast moving 45 degree equity curve that is headed to infinity…I hope.
So what is it I see in the market that has given me great results. Let me explain below with some charts and I hope you the reader are able to have similar results.
I trade Futures contracts. My contract of choice is the Nasdaq 100 or the NQ - I use the ES chart as a master chart as NQ tracks the ES and setups that appear on the ES I use to execute on the NQ. I chose Nasdaq futures after many years of trading the CL; Oil futures, because NQ is the most liquid market and the volatility and moves can be absolutely staggering. Hence the opportunity to make large amounts of money.
My Setup.
I use a tick chart on the thinkorswim platform. Mainly the 4181 tick chart. I like the tick chart because every bar formed is 4181 trading transactions completed as opposed to a minute chart which forms every 1,5 or 15 minutes etc. I sense the flow of the market a lot better with a tick chart as opposed to a minute chart. I overlay the 4181 tick chart with one indicator only, the 50 EMA and price levels on the ES chart. That is it. Nothing else. No RSI, Stochastics, Bollinger Bands or other fancy indicators or drawings. Simplicity is king. All you want to look at is the chart, get a feel for the market and use the EMA as a direction for the trend.
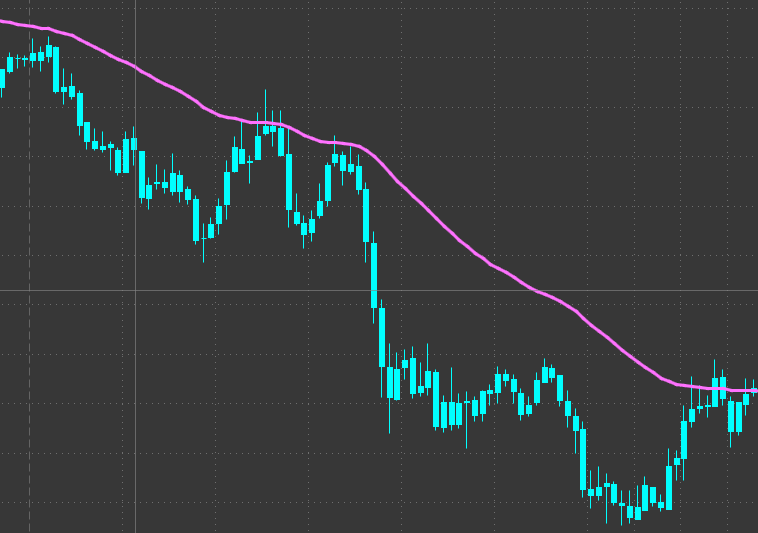
The chart above is a 4181 tick chart of the NQ with a 50 EMA. This was a day when the markets trended down ward rather quickly, this is my favorite type of market to trade. On a down ward trend when the price bar hits the 50 EMA and bounces back to continue the trend that is when I short, a fixed stop loss goes above the EMA. The stop loss is always fixed and never moves. I have a profit target of 3:1 or greater and I just let the trade play out.

Similarly on a up trend day. I do the reverse. When the market is making an upward move, I wait for it to retrace to the EMA and when it does, that is where I buy with the stop loss below the EMA and I let the trade play out with a minimum R:R of 3:1. My trading is as simple as that and with this kind of simplicity I have been able to make a killing from the markets.

Another very important tool to incorporate into your charts is price levels. The chart above is for the ES. I have four levels on the chart everyday. PDH - Previous Day High, ONH - Over Night High, ONL - Over Night Low, PDL - Previous Day Low. The ES respects price levels and once you become familiar reading charts and drawing price levels everyday, you should be able to guess fairly accurately what price is going to do.
If you look at the chart above the market opened up, gyrated for a bit, dove down to PDL and then made a beeline straight to ONH. See how price bounced off the PDL and then hit ONH and retraced? This is an Edge, and a probability based trade. I would take that bounce off a level everyday. As you spend more time reading charts and trading, you will notice how price reacts at important levels.
If you are trading the NQ or YM keep an ES chart open with previous day price levels drawn and observe how NQ and YM follow ES from open to close.
If you are still struggling, work harder to study charts, keep a journal of everything you see, and keep your trading as simple as possible.
You should do well.

Do you ever trade overnight or just during regular hours?
Yes. NY time: 9.30am to 4pm. Real trading hours & 6pm to 9.29am Overnight hours